


 Free
Web
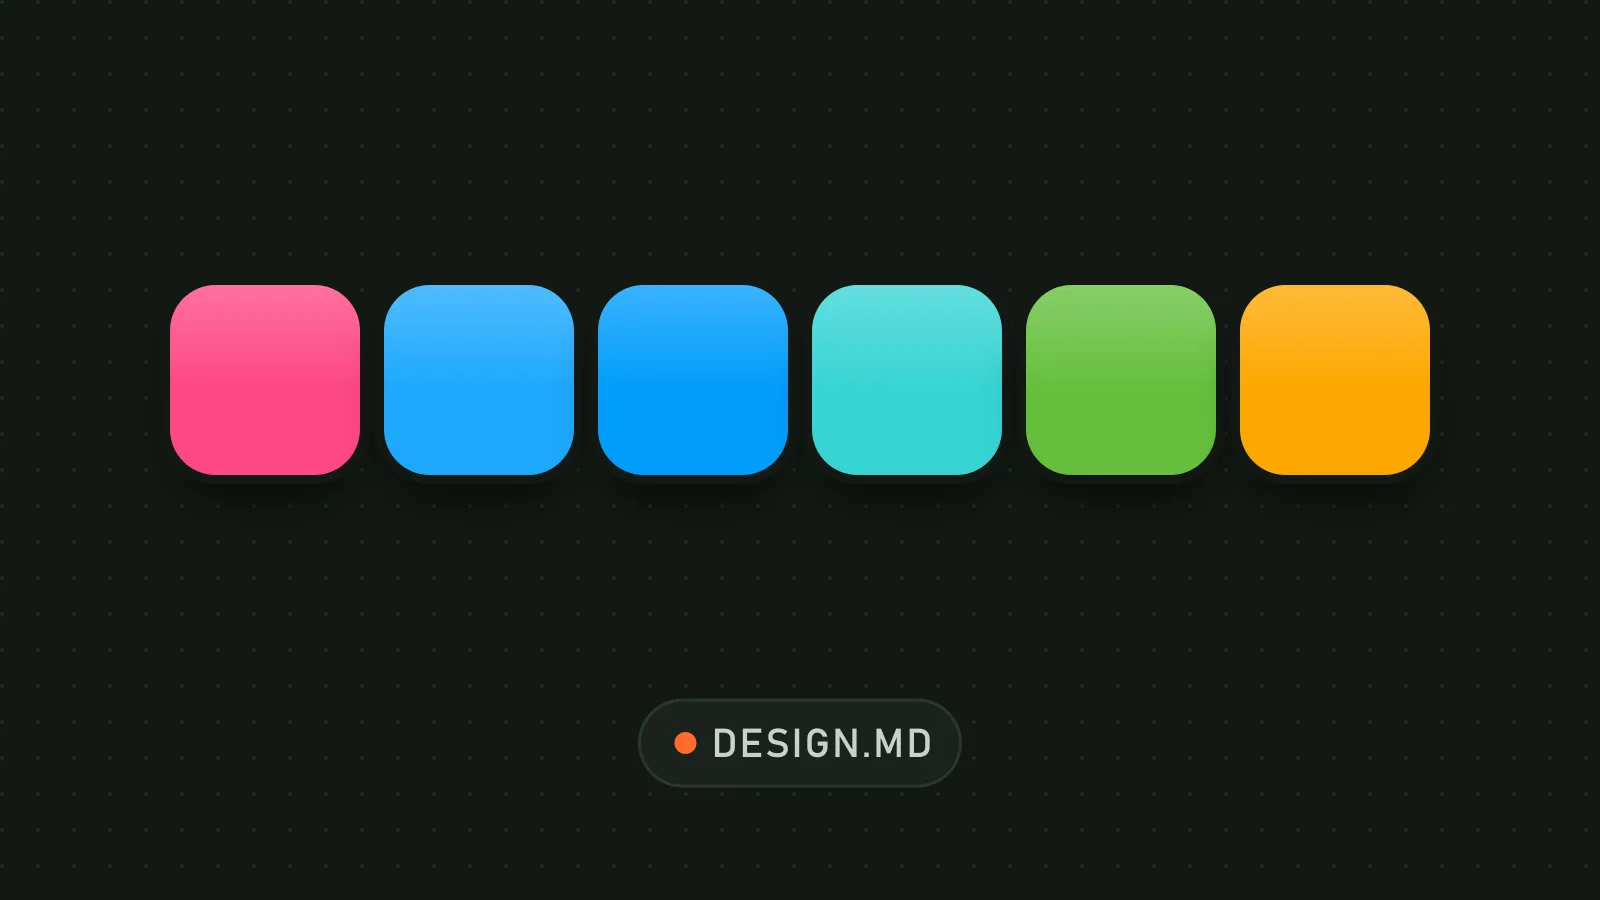
Component documentation in coral and blue
- 219219 downloads
- 145145 likes
- 154154 saves
Works with
- Claude Code
- Codex
- Cursor
- and 3 more
Every premium and members-only resource for $9.99/month, as a no-commitment subscription. See the plans
Use this resource to build a metrics and monitoring dashboard
New
Free
In a terminal, from the folder you want:
npx --yes palatekit@latest install violet-observability-dashboard-uiFirst time: connect the CLI with
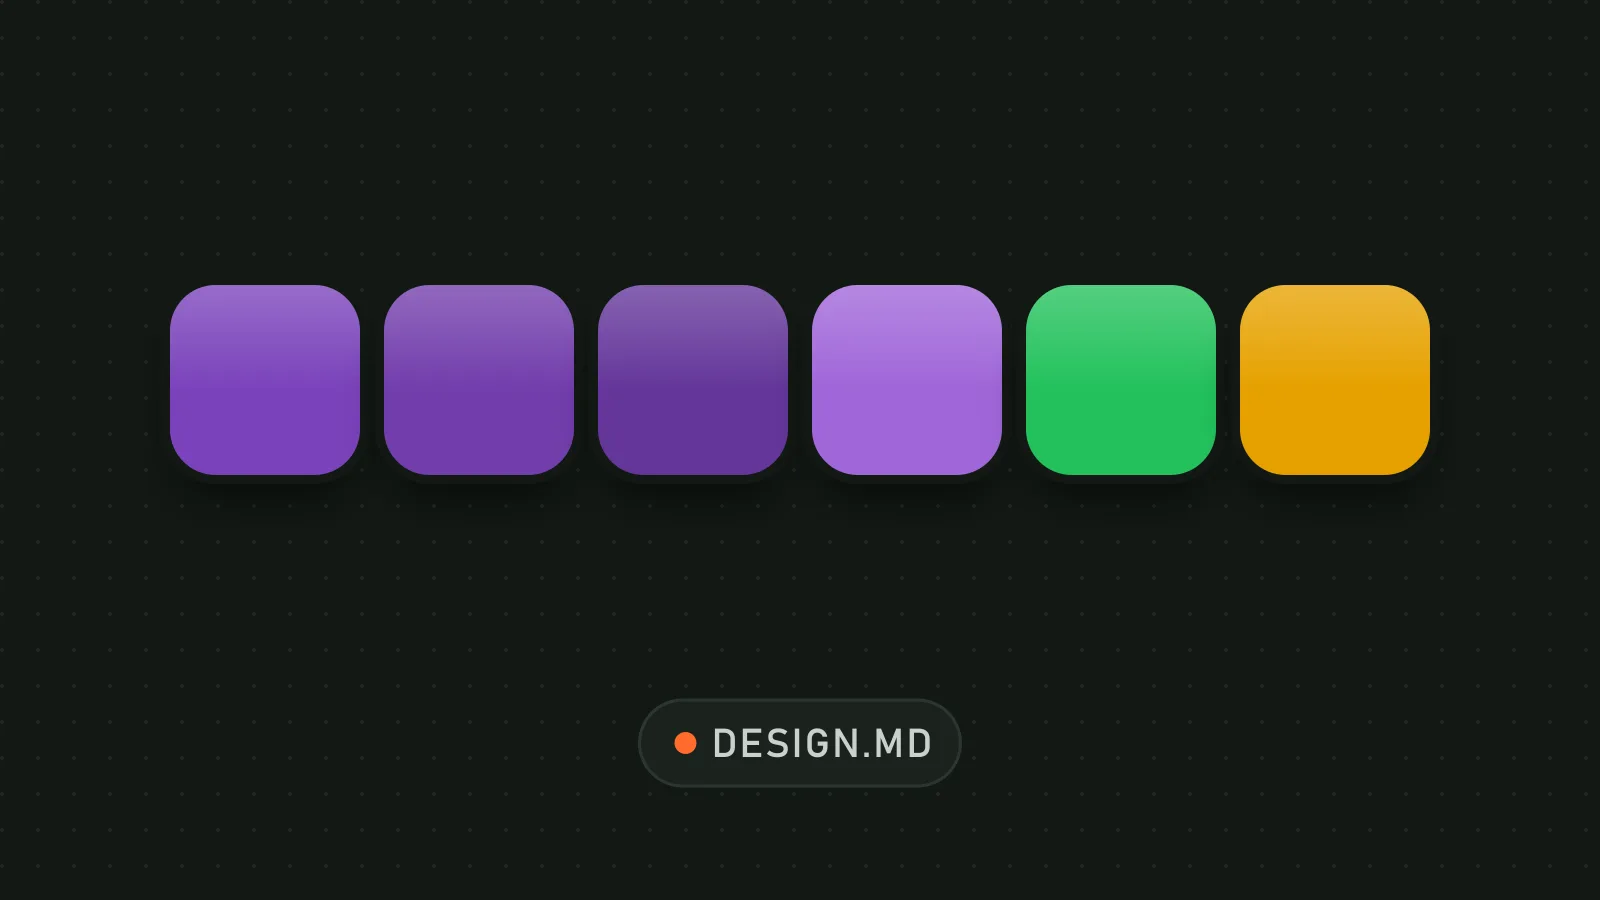
npx --yes palatekit@latest loginThe agent places charts at the center and applies the violet accents and dark surfaces described while keeping data in front. You get an organized technical dashboard that is easy to read when monitoring services.
Updated November 2, 2026
FreeWeb
 Free
Web
 Free
Web
 Free
Web
 Free
Web
 Free
Web
 Free
Web
 Free
Web
You say
“Build my service performance dashboard following DESIGN.md.”
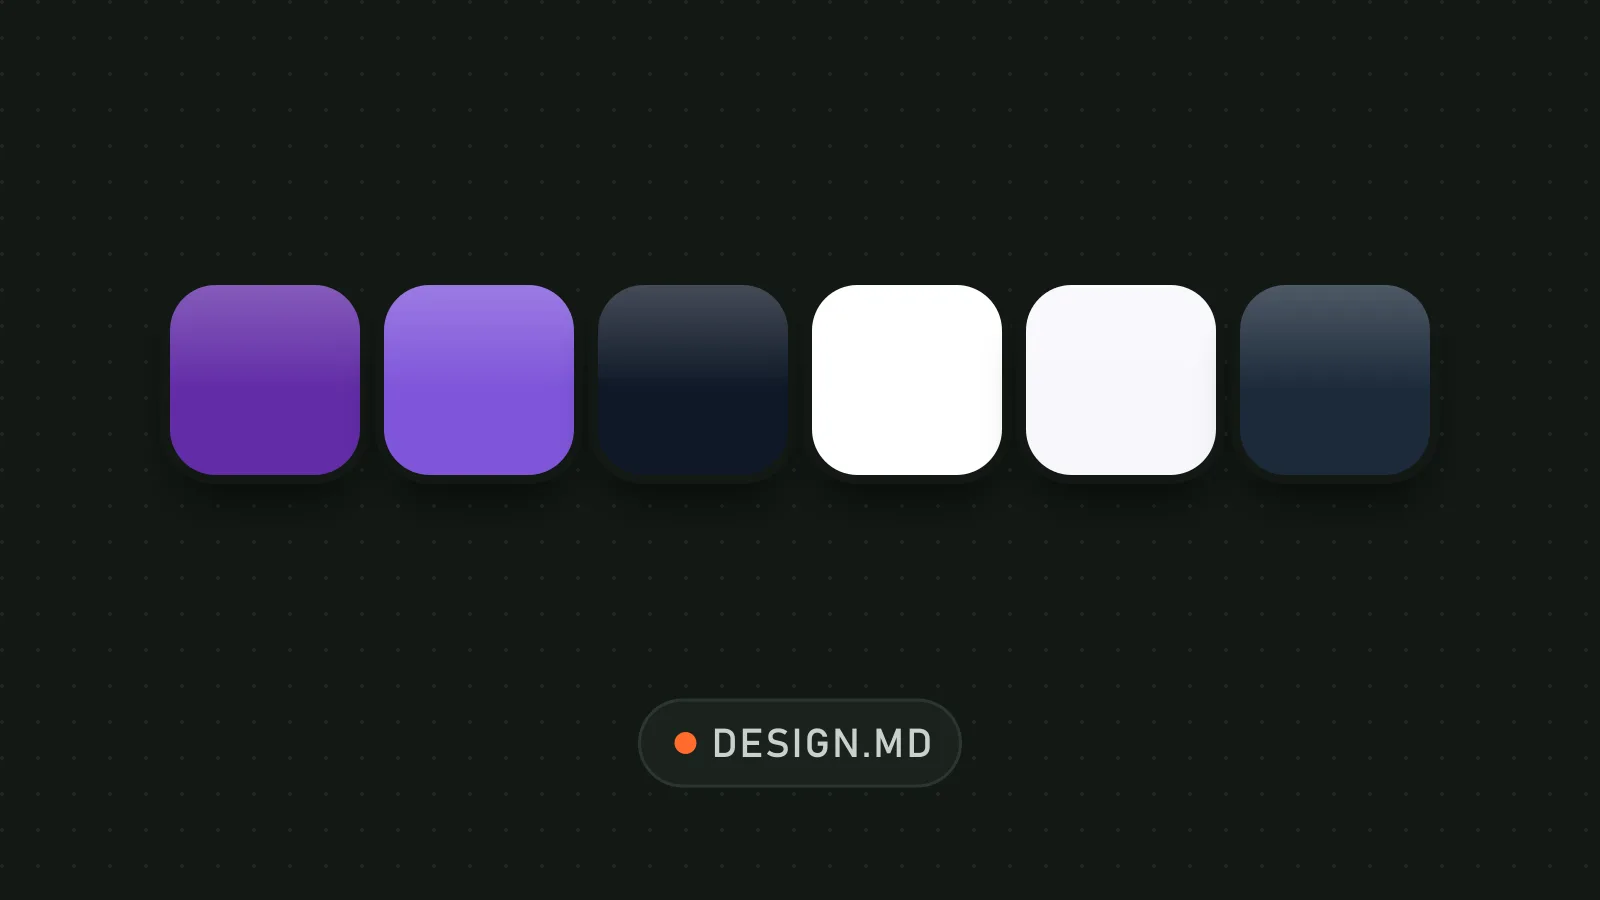
DESIGN.md published by Khalidabdi1 under the MIT license, delivered in its original version.
Listed unmodified
« datadog » (Khalidabdi1, MIT) livré dans sa version d'origine : fiche en français et en anglais par PalateKit.
–
No ratings yet
Loading reviews…