


 Free
Video
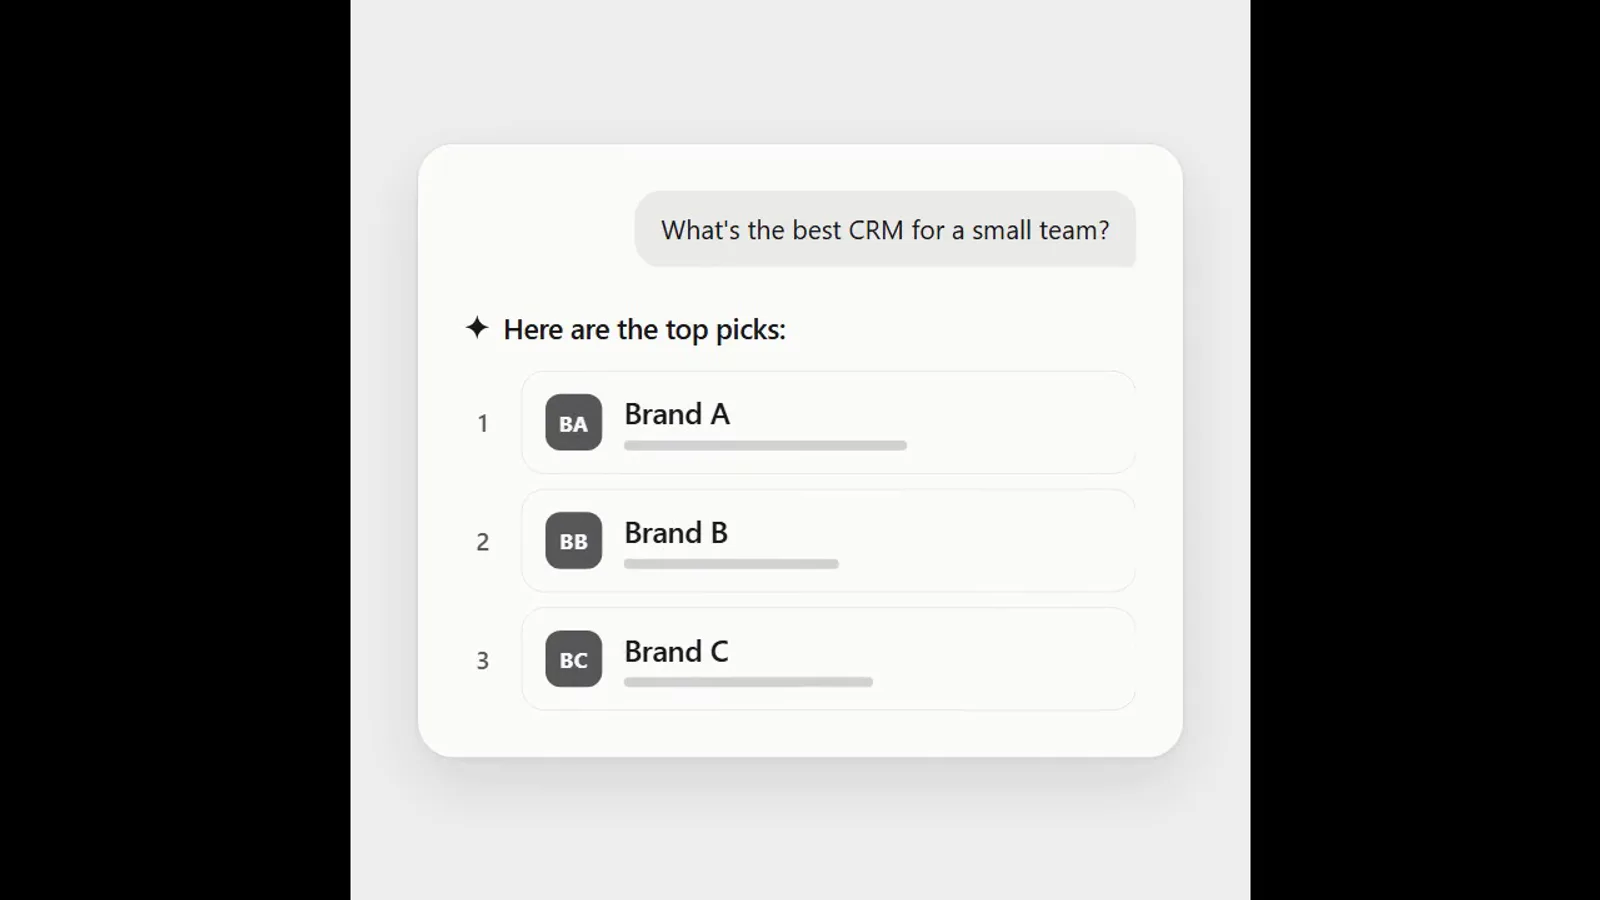
AI answer where a brand climbs the ranking
- 570570 downloads
- 126126 likes
- 226226 saves
Works with
+ HyperFrames- Claude Code
- Codex
- Cursor
- and 3 more
Every premium and members-only resource for $9.99/month, as a no-commitment subscription. See the plans
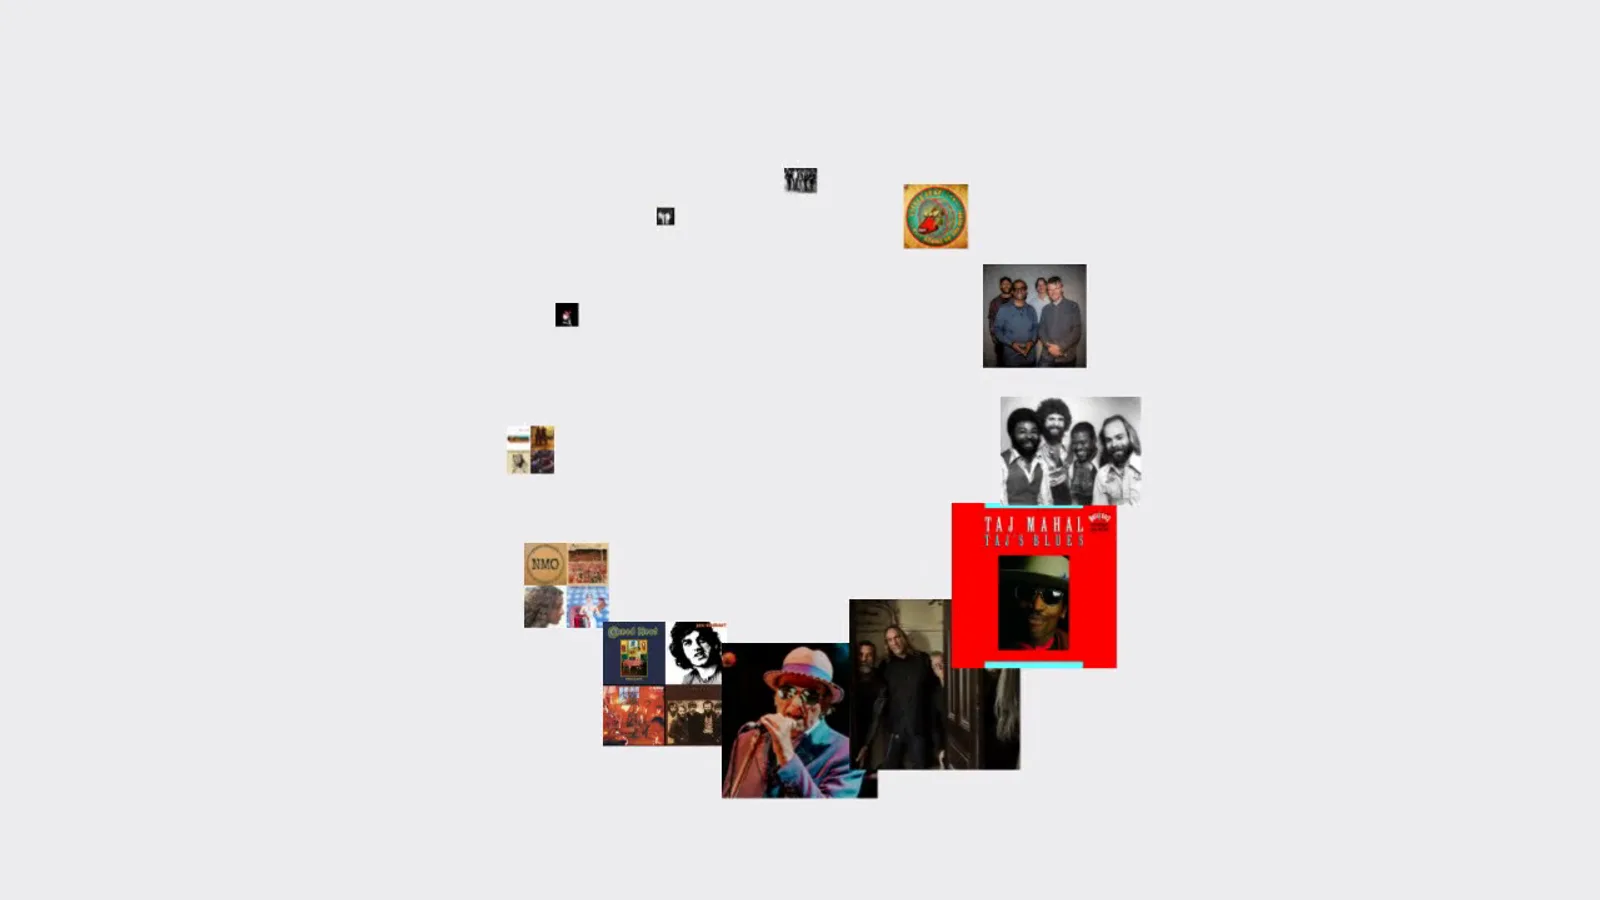
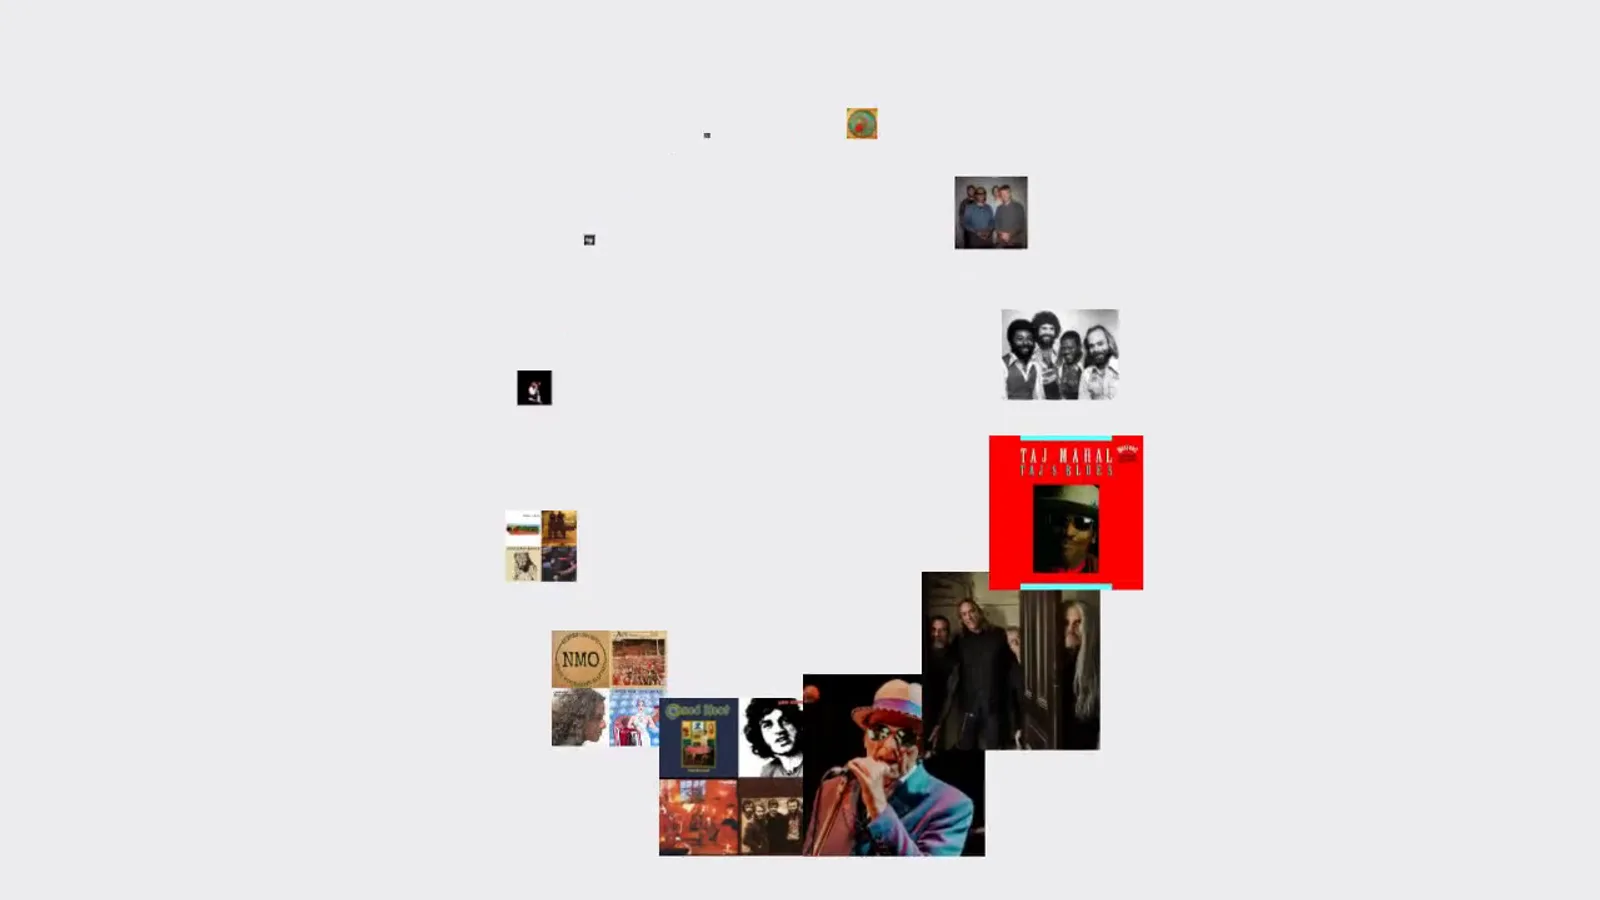
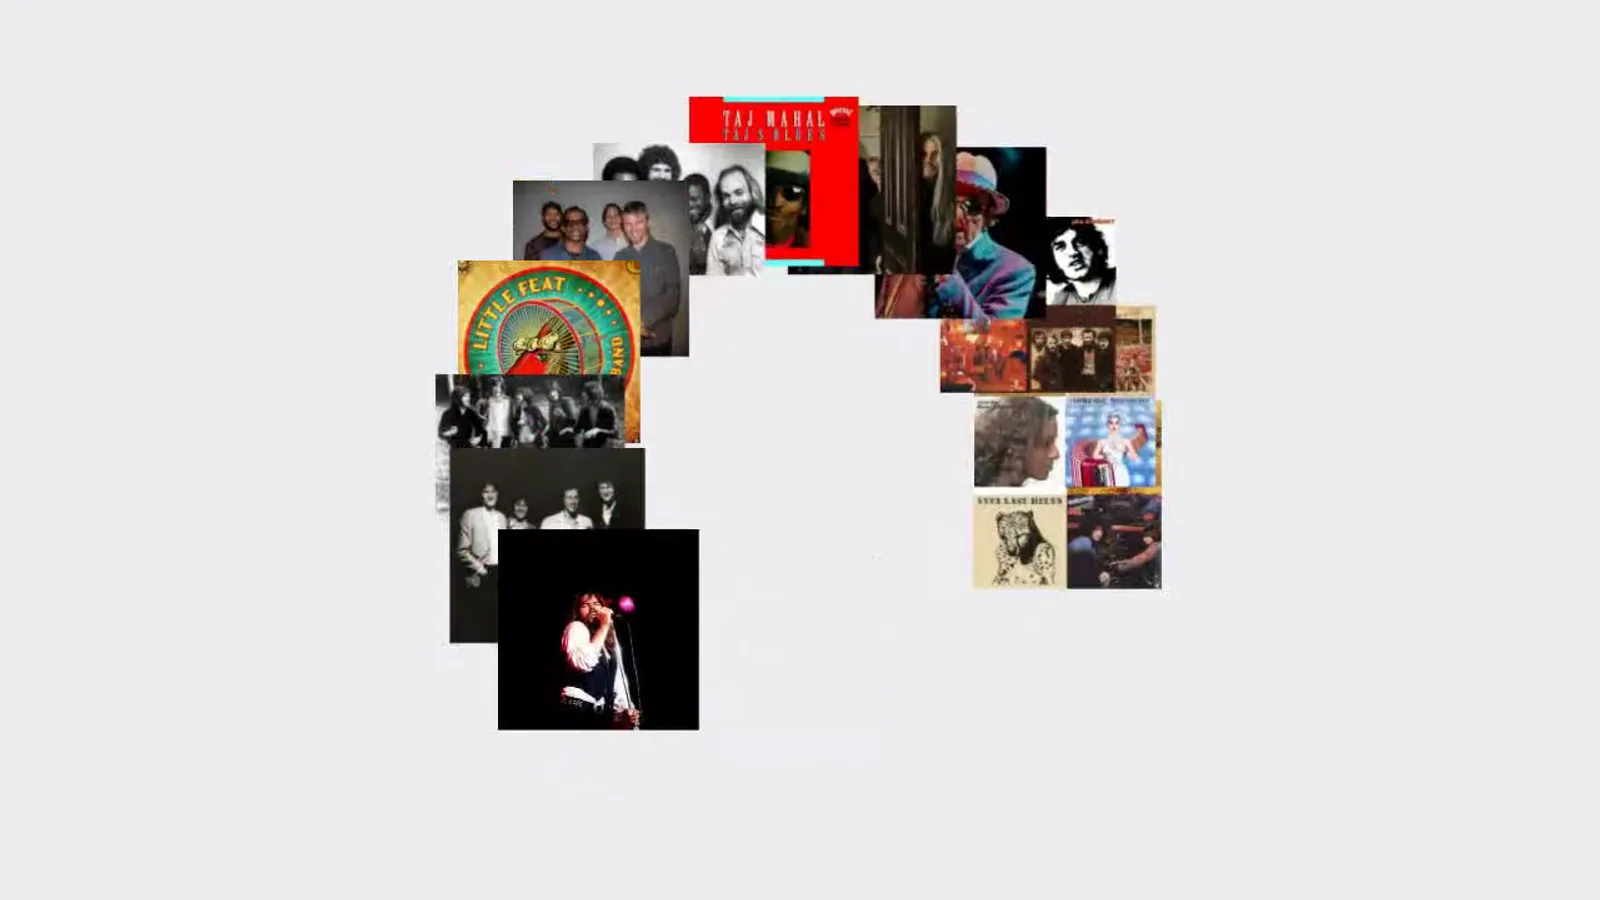
Use this resource to animate how a data ranking changes over time
New
Free
In a terminal, from the folder you want:
npx --yes palatekit@latest install bar-chart-raceFirst time: connect the CLI with
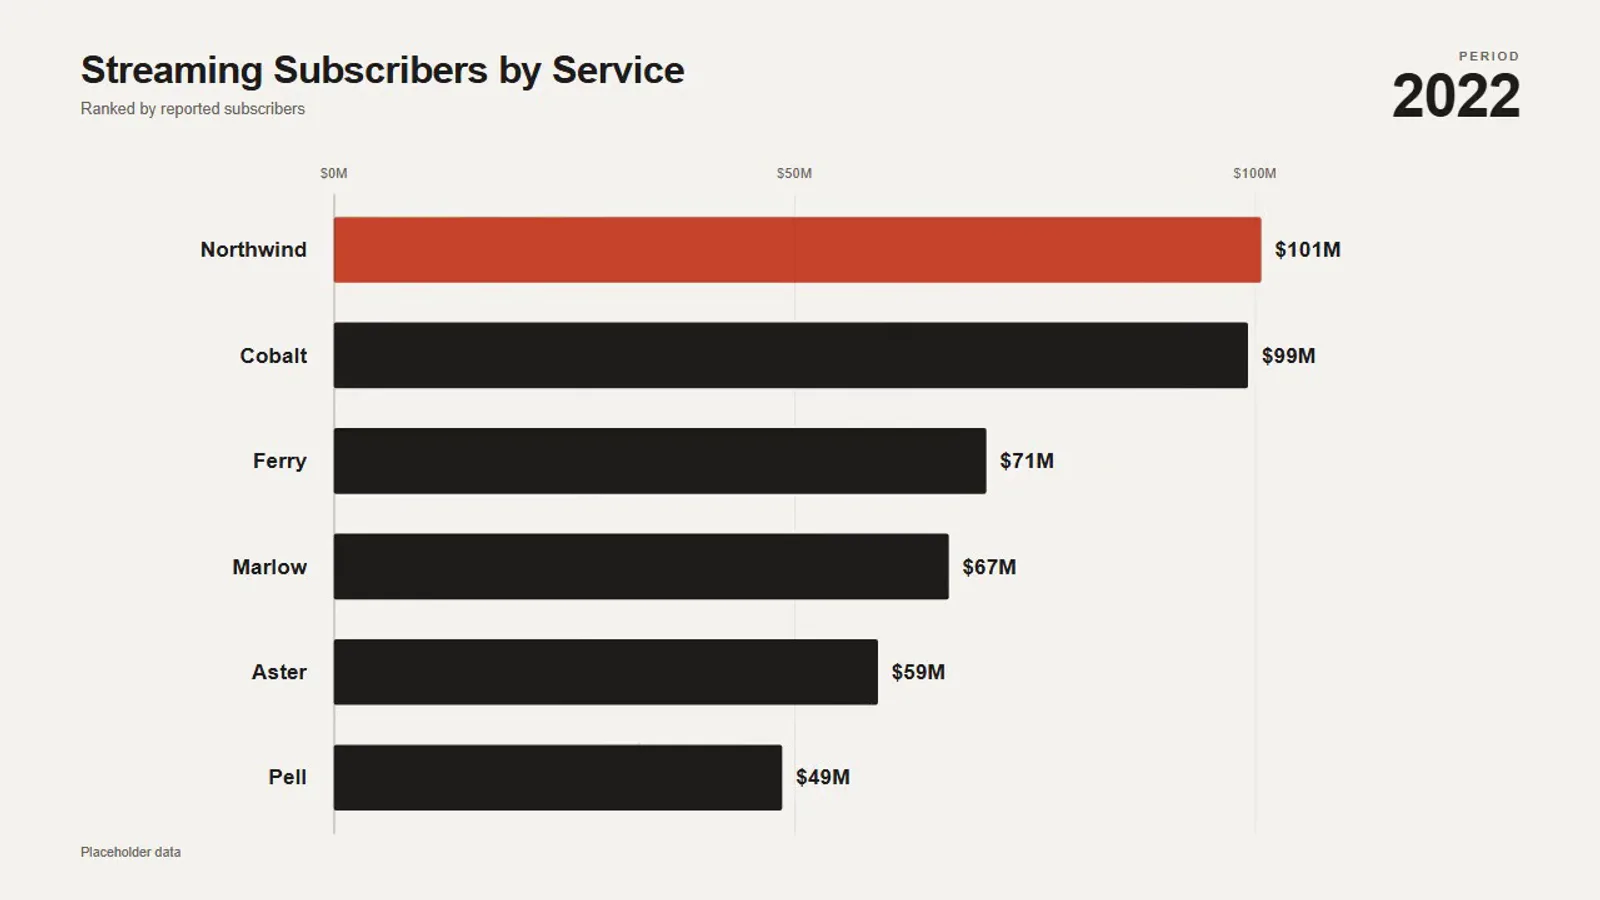
npx --yes palatekit@latest loginThe agent adds a composition rendered as video to your HyperFrames project: a bar chart race over several periods. You enter the title, periods, series (one per line), number of bars shown, seconds per period and value format. You get an animated chart ready to drop in.
Mostly picked by
Updated November 2, 2026
FreeVideo
 Free
Video
 Free
Video
 Free
Video
 Free
Video
 Free
Video
 Free
Video
 Free
Video
You say
"Make a bar chart race from 2019 to 2024 with my four competitors, 2 seconds per year, with the leader in orange."
Composition published by HeyGen (HyperFrames) under the Apache-2.0 license, resource page and guide written by PalateKit.
Modified by PalateKit
Version modifiée de « Bar Chart Race » (HeyGen (HyperFrames), Apache-2.0) : traduction française et fiche par PalateKit.
–
No ratings yet
Loading reviews…
Yes: the composition renders to video with HyperFrames (Node.js). The agent can install it and run the render.
Yes, they live in the HTML file. Give the agent your texts and palette.