Every premium and members-only resource for $9.99/month, as a no-commitment subscription. See the plans

PalateKit

Menu

Request a resource

Describe the resource you are missing in one sentence. We will email you when it is published.

0 / 280

Unlock PalateKit

Unlock everything

Plan

Paying means accepting our terms of sale.

Secure payment by Stripe. Receipts and invoices sent by email.

Welcome back

Sign in to install, download or save this resource. A free account is enough for free resources.

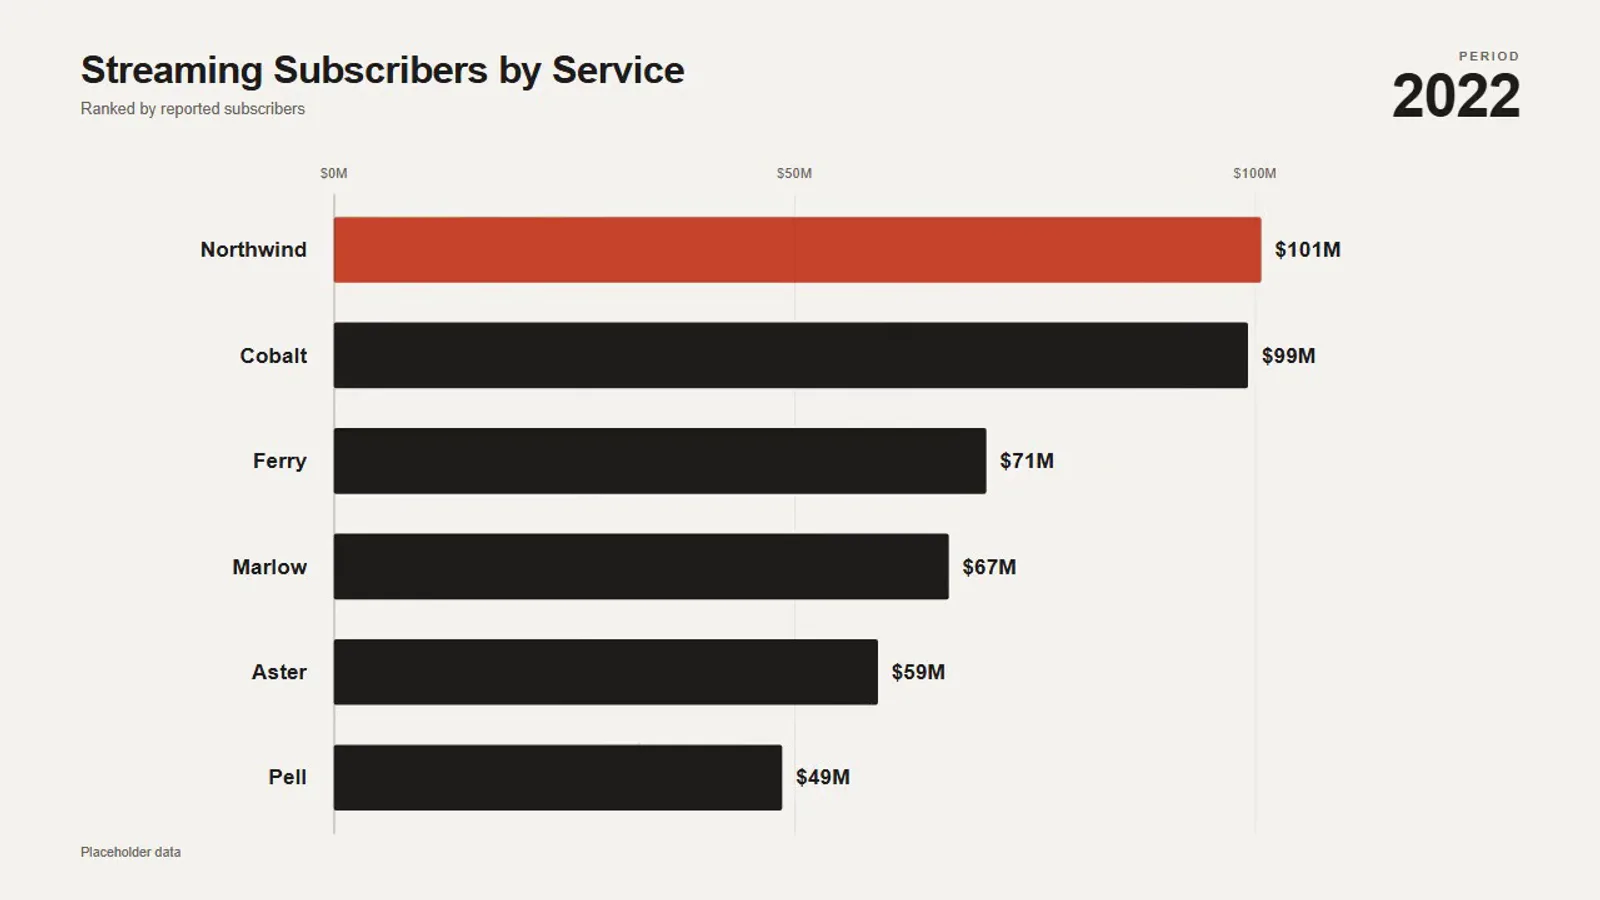
Animated chart: bars, line, donut or progress bars v1.0.0

Use this resource to animate a data chart in a video

New

  • 476 downloads
  • 181 likes
  • 185 saves

Free

Install with the CLI

In a terminal, from the folder you want:

npx --yes palatekit@latest install animated-data-chart

First time: connect the CLI with

npx --yes palatekit@latest login

The agent adds to your HyperFrames composition a chart of your choice: bars, line with area, donut or progress bars. You enter the data, the labels, the unit and the value to emphasize. You get clear numeric proof for your video.

Mostly picked by

Updated November 2, 2026

Details

Generates with
HyperFrames
Uses
  • HyperFrames (npx hyperframes)
  • Node.js
Licence
Apache-2.0

Similar resources

View all

What you get

  • README.md: usage guide
  • chart-story.html: the author's original file
  • demo.html: the author's original file
  • README.md: the author's original file
  • registry-item.json: the author's original file

Good fit for

  • Present quarterly results in a video
  • Show measured growth in a pitch
  • Illustrate a key statistic in a reel

Not for

  • A classic video edit without HyperFrames or Node.js
  • An animation that must run as is on a web page

Tags

  • chart
  • data
  • statistics
  • bars
  • proof

About

You say

"Animate a bar chart with 12, 28, 45 and 64 for Q1 to Q4, and highlight the last value."
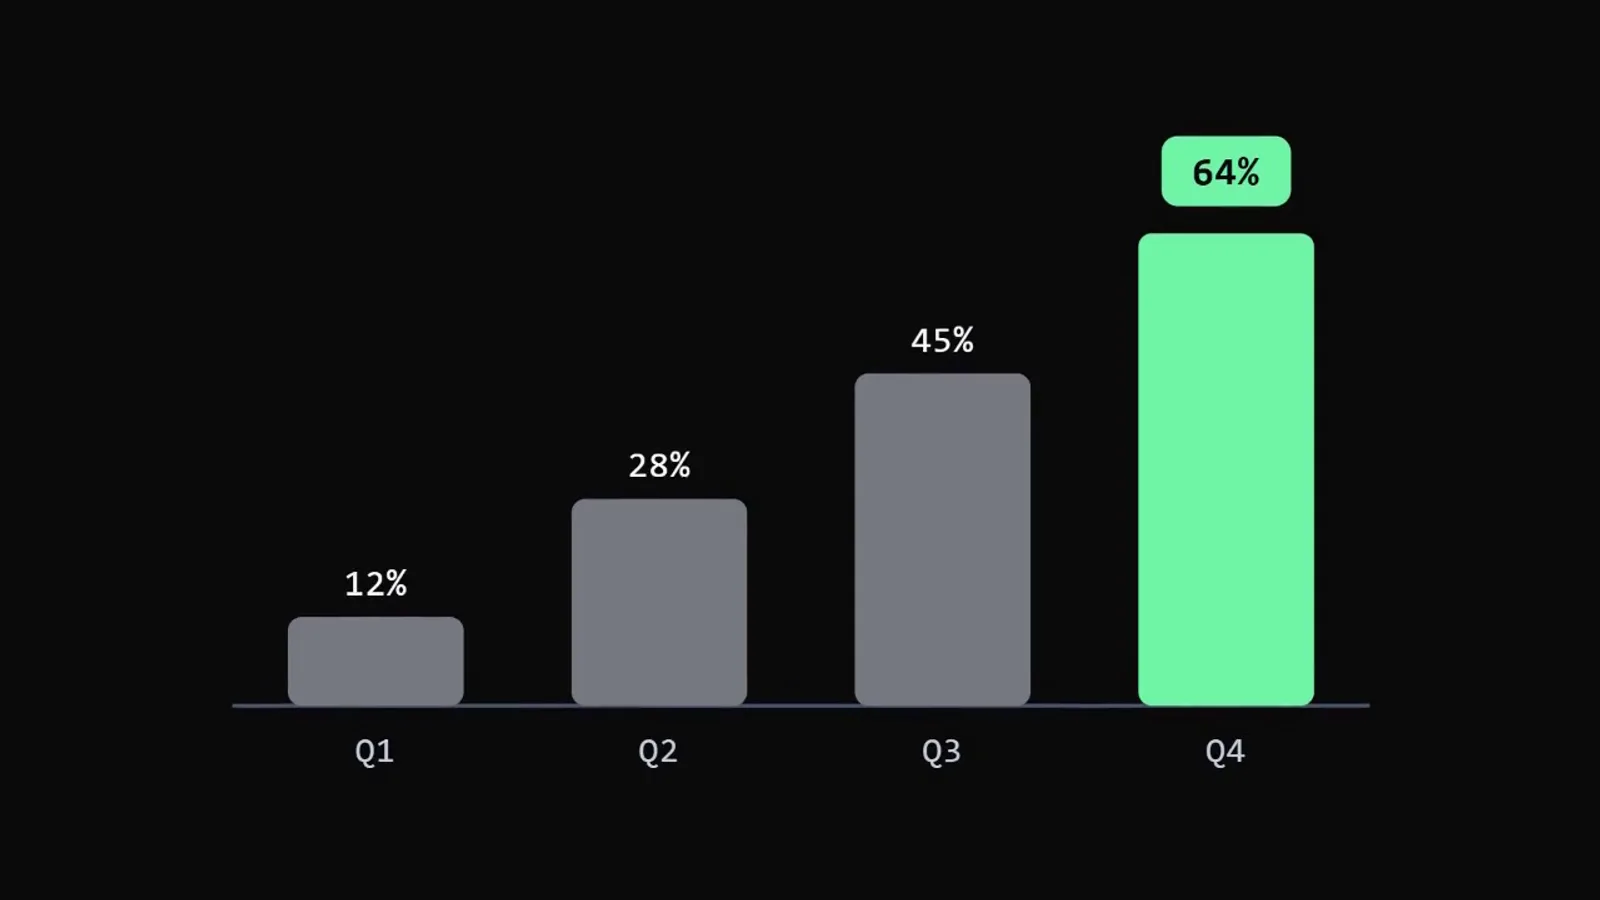
A bar chart that builds up with one value highlighted in a callout.

Composition published by HeyGen (HyperFrames) under the Apache-2.0 license, resource page and guide written by PalateKit.

Show more

Prerequisites

You bring
Your texts and colors and A HyperFrames project (or the agent creates one)
Dependencies
HyperFrames (npx hyperframes) and Node.js

How to use it

  1. Install it in your HyperFrames project with npx hyperframes add chart-story, or copy the provided files.
  2. Ask the agent to change the texts, colors and duration in the HTML file.
  3. Run the HyperFrames preview, then the render, to get the video.

Content preview

Files

  • chart-story.html29.8 KB
  • demo.html2.1 KB
  • LICENSE10.5 KB
  • NOTICE-PALATEKIT.md0.4 KB
  • README.md0.8 KB
  • registry-item.json3 KB

Origin and licence

Modified by PalateKit

Author
HeyGen (HyperFrames)
Source
github.com/heygen-com/hyperframes/tree/2c3d1e07fe63d4a2d67d63a3e29d4ad73e291d8e/registry/components/chart-story
Licence
Apache-2.0

Notice

Version modifiée de « Chart Story » (HeyGen (HyperFrames), Apache-2.0) : traduction française et fiche par PalateKit.

User reviews

–

No ratings yet

Loading reviews…

Delete your review?

Your rating and comment will be removed from the page.

Frequently asked questions

Do I need HyperFrames?

Yes: the composition renders to video with HyperFrames (Node.js). The agent can install it and run the render.

Can I change the texts and colors?

Yes, they live in the HTML file. Give the agent your texts and palette.