Every premium and members-only resource for $9.99/month, as a no-commitment subscription. See the plans

PalateKit

Menu

Request a resource

Describe the resource you are missing in one sentence. We will email you when it is published.

0 / 280

Unlock PalateKit

Unlock everything

Plan

Paying means accepting our terms of sale.

Secure payment by Stripe. Receipts and invoices sent by email.

Welcome back

Sign in to install, download or save this resource. A free account is enough for free resources.

Animated World Map Colored by Country v1.0.0

Use this resource to show country-level data on an animated world map

New

  • 518 downloads
  • 209 likes
  • 162 saves

Free

Install with the CLI

In a terminal, from the folder you want:

npx --yes palatekit@latest install world-map-gdp-choropleth

First time: connect the CLI with

npx --yes palatekit@latest login

The agent swaps the sample data (2024 GDP per capita) for your figures, title, legend and source. Countries color in gradually, labels appear and a globe rotates in an inset. You get a 14 second sequence useful for a client report, a lesson or a research video.

Updated November 2, 2026

Details

Generates with
HyperFrames
Uses
  • HyperFrames (npx hyperframes)
  • Node.js
Licence
Apache-2.0

Similar resources

View all

What you get

  • README.md: usage guide for the block
  • world-map.html: the animated map, its sample data and legend
  • registry-item.json: 1920×1080 format, 14 s duration

Good fit for

  • Presenting country data in a video report
  • Illustrating a geography or economics lesson
  • Showing a company's international footprint

Not for

  • City or neighborhood maps
  • Offline rendering: the libraries and outlines are loaded online

Tags

  • world map
  • data
  • choropleth
  • geography

About

You say

"Color the world map by our sales per country (data in this table), with the title "2025 Sales" and the source "Internal data"."
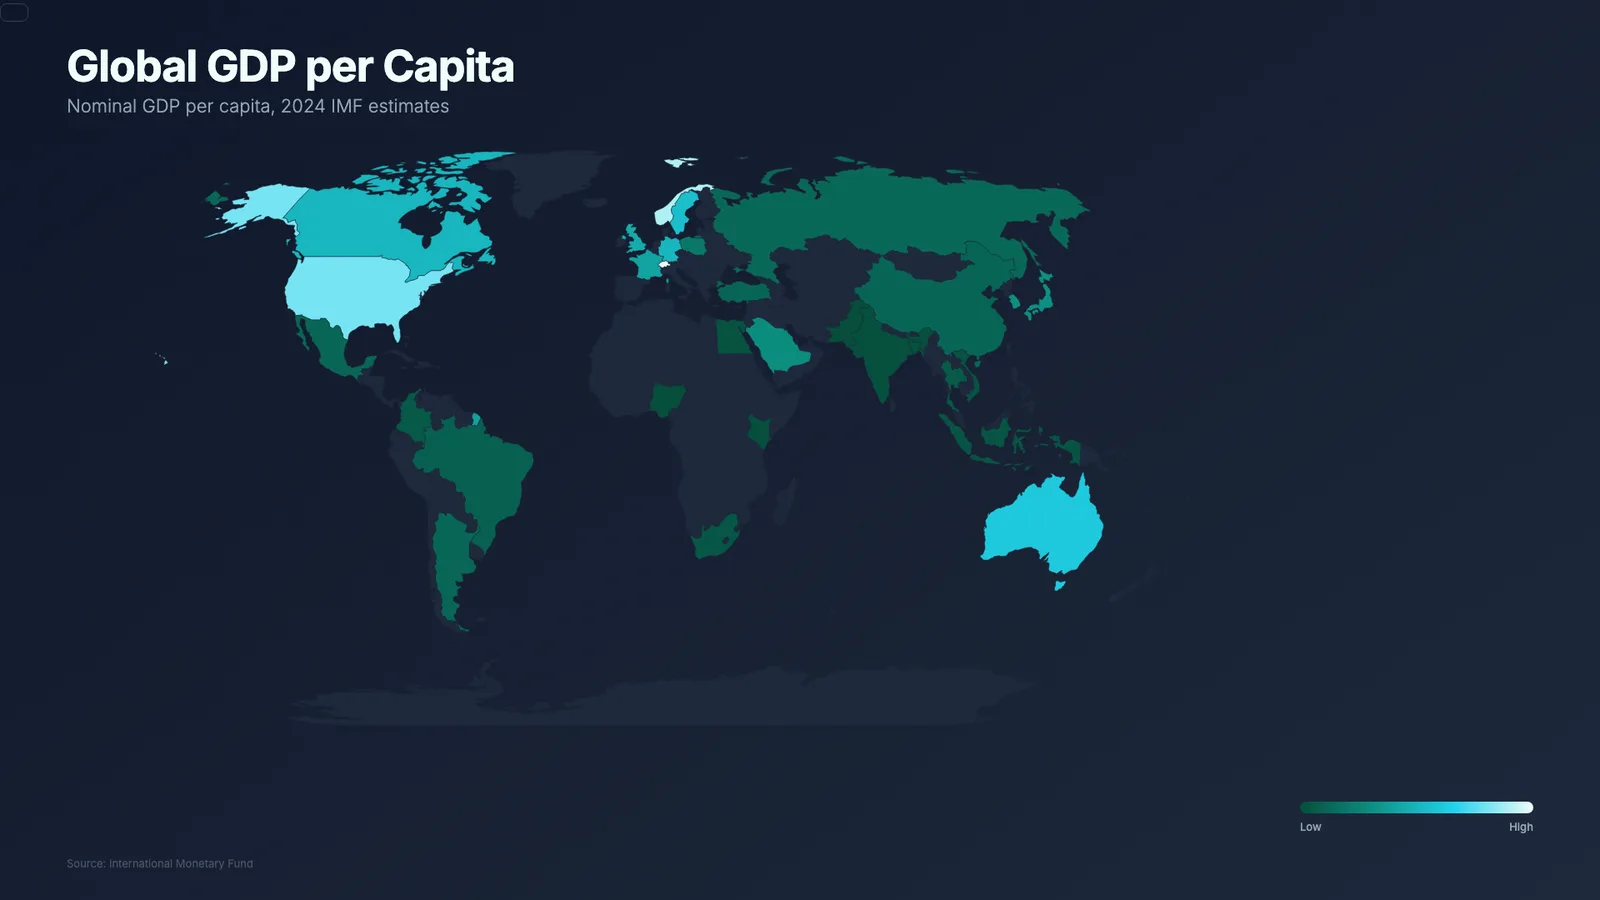
World map colored by country from dark green to light teal, with legend and title.

Block published by HeyGen (HyperFrames) under the Apache-2.0 license.

Show more

Prerequisites

You bring
Your data per country and The title and source to display
Dependencies
HyperFrames (npx hyperframes) and Node.js

How to use it

  1. Install the block with npx hyperframes add world-map.
  2. Give your data to the agent: it updates the gdpData object (key = 3-digit numeric country code), the title, the legend and the source.
  3. Run the HyperFrames render with an internet connection.

Content preview

Files

  • LICENSE10.5 KB
  • NOTICE-PALATEKIT.md0.4 KB
  • README.md0.9 KB
  • registry-item.json0.8 KB
  • world-map.html12.6 KB

Origin and licence

Modified by PalateKit

Author
HeyGen (HyperFrames)
Source
github.com/heygen-com/hyperframes/tree/2c3d1e07fe63d4a2d67d63a3e29d4ad73e291d8e/registry/blocks/world-map
Licence
Apache-2.0

Notice

Version modifiée de « World Map » (HeyGen (HyperFrames), Apache-2.0) : traduction française et fiche par PalateKit.

User reviews

–

No ratings yet

Loading reviews…

Delete your review?

Your rating and comment will be removed from the page.

Frequently asked questions

Where do the country outlines come from?

They are loaded at render time from the world-atlas package, with D3 and topojson, through the jsDelivr network. An internet connection is therefore required.

How is a country identified?

By its 3-digit numeric ISO 3166 code (for example 250 for France), used as the key in gdpData.