


 Free
Video
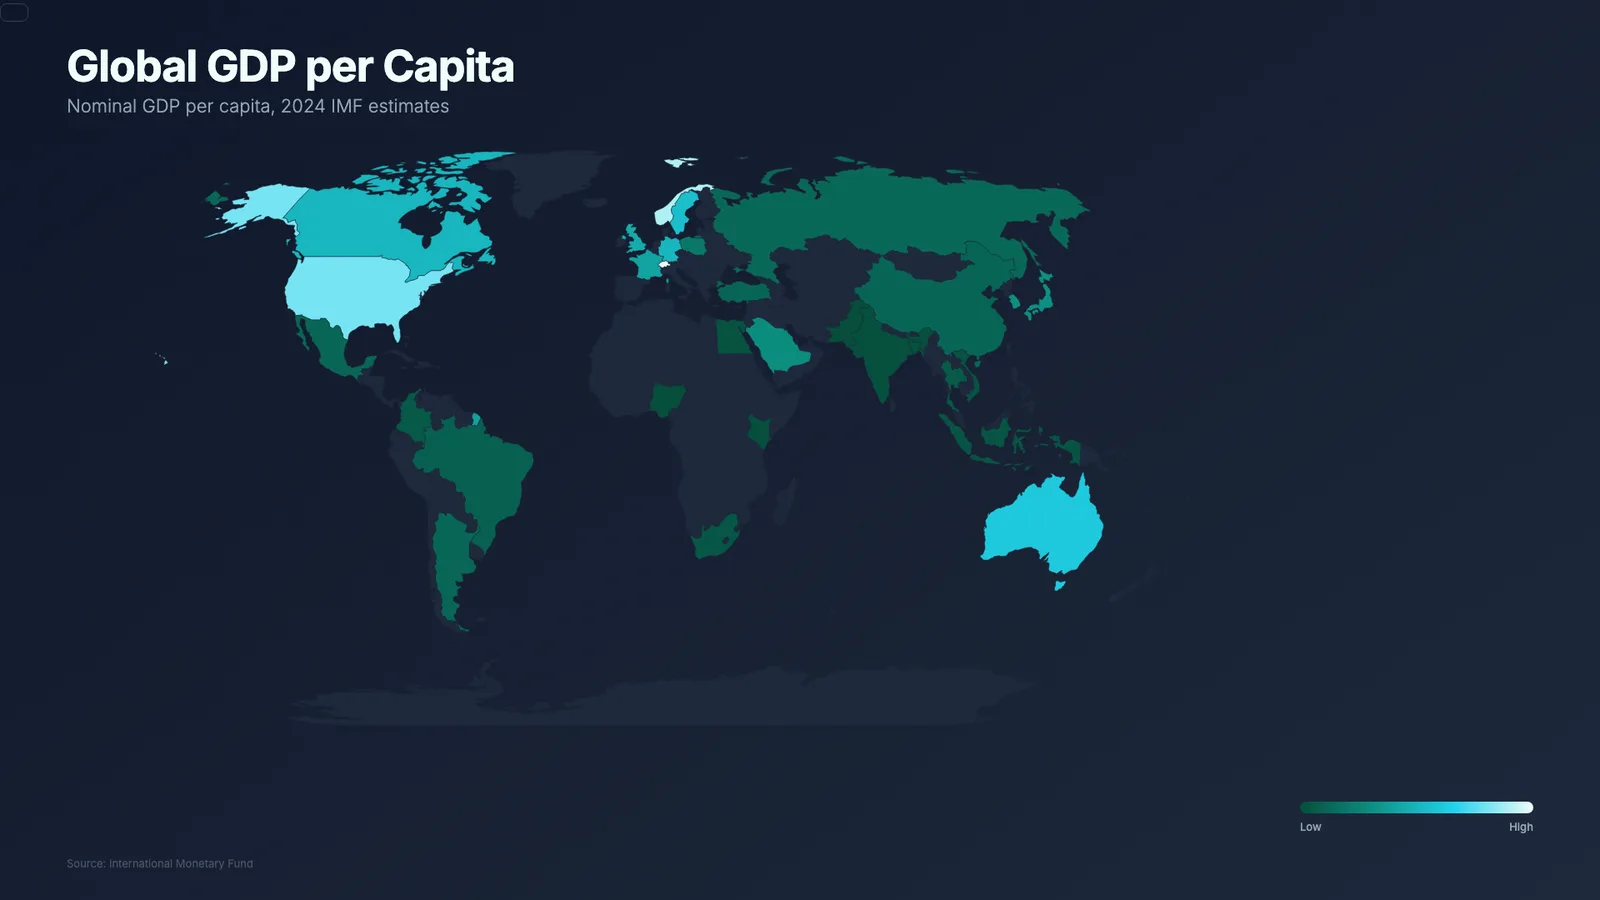
Animated World Map Colored by Country
- 518518 downloads
- 209209 likes
- 162162 saves
Works with
+ HyperFrames- Claude Code
- Codex
- Cursor
- and 3 more
Every premium and members-only resource for $9.99/month, as a no-commitment subscription. See the plans
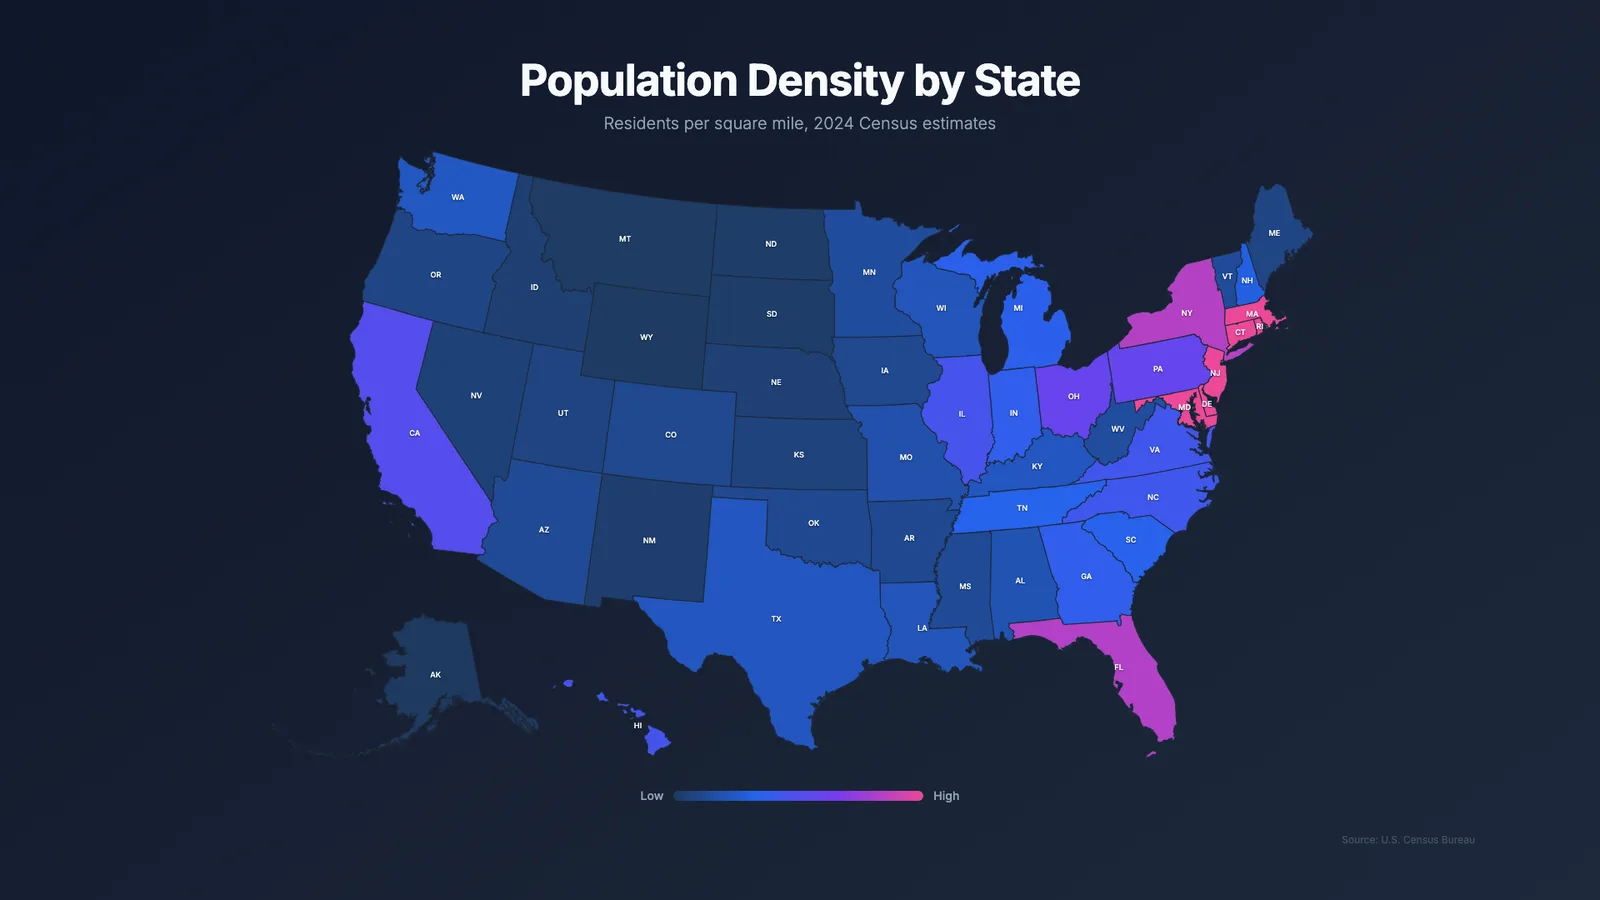
Use this resource to present a per-state US metric in an animated video
New
Free
In a terminal, from the folder you want:
npx --yes palatekit@latest install us-choropleth-mapFirst time: connect the CLI with
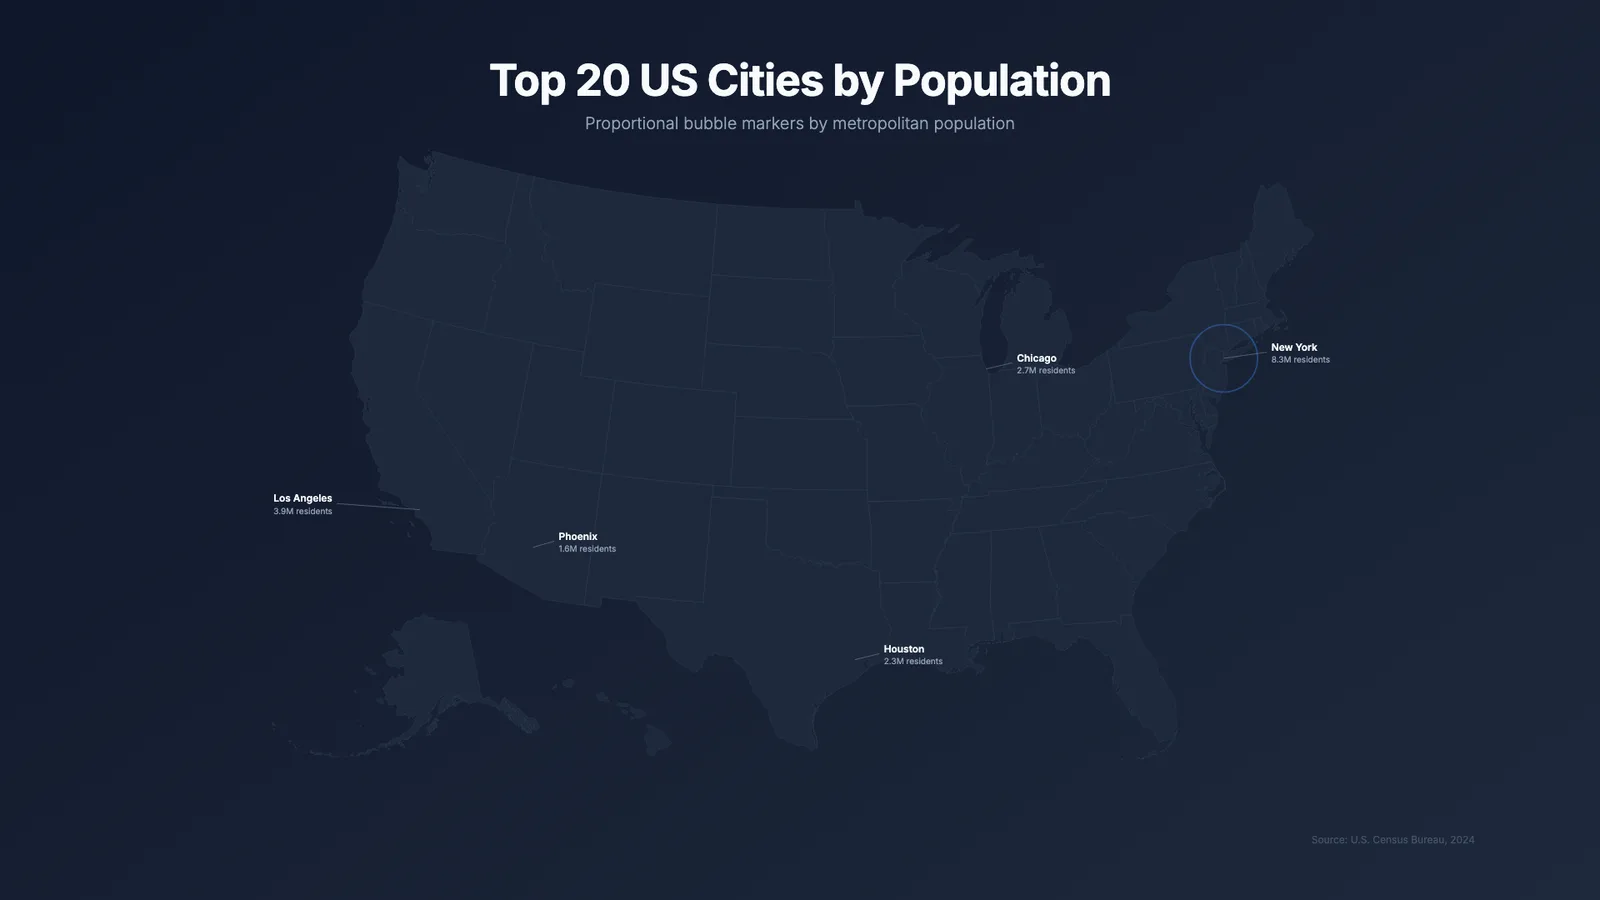
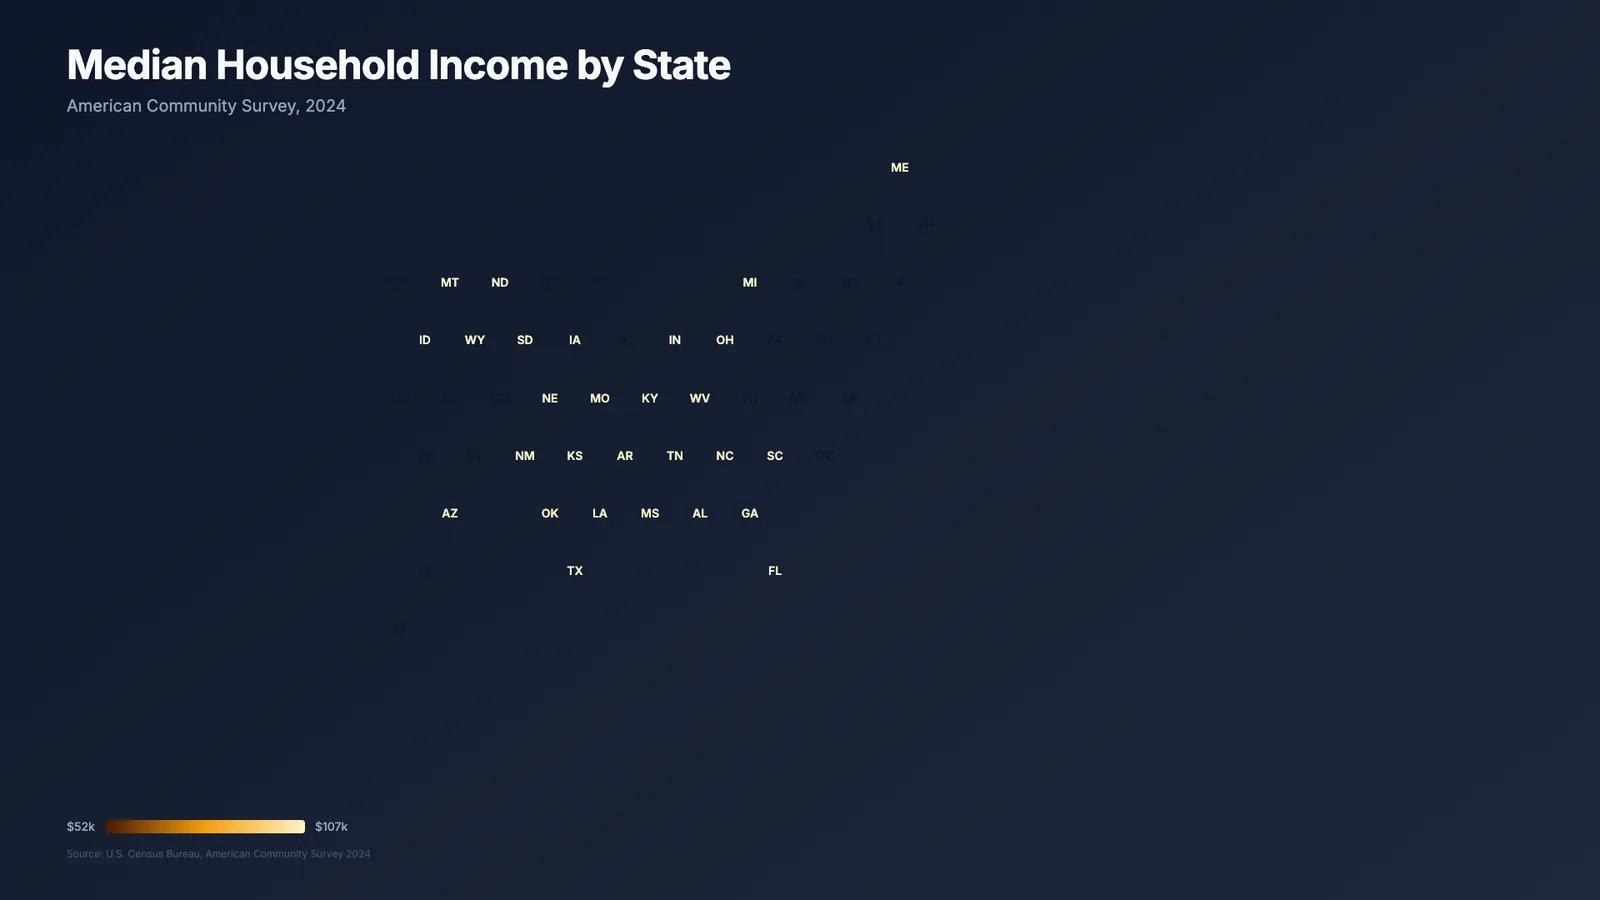
npx --yes palatekit@latest loginThe agent replaces the per-state data (name, abbreviation, value) and the subtitle, then the coloured map reveals state by state, with values shown and a few states highlighted. The example shows population density.
Mostly picked by
Updated November 2, 2026
FreeVideo
 PRO
Video
 Free
Video
 Free
Video
 PRO
Video
 PRO
Video
 PRO
Video
 PRO
Video
You say
"Replace the density with my sales per state in dollars, set the subtitle 'Sales 2026 by state' and highlight CA, NY and TX."
Template published by HeyGen (HyperFrames) under the Apache-2.0 license.
Modified by PalateKit
Version modifiée de « US Map » (HeyGen (HyperFrames), Apache-2.0) : traduction française et fiche par PalateKit.
–
No ratings yet
Loading reviews…
At render time the HTML downloads the us-atlas shape file (JSON) from jsdelivr, along with d3 and topojson-client, so an internet connection is required.
Edit the stateData object (numeric state key, name, abbreviation, value) and maxDensity, which sets the top of the colour scale.